Dead stock is the least dramatic problem in retail. There's no stockout, no empty peg, no angry customer at the counter. A few thousand SKUs simply stop selling, and because nothing visibly breaks, nobody goes looking. By the time someone does, the only lever left is the markdown pen. And by then you're not managing inventory anymore. You're managing loss.
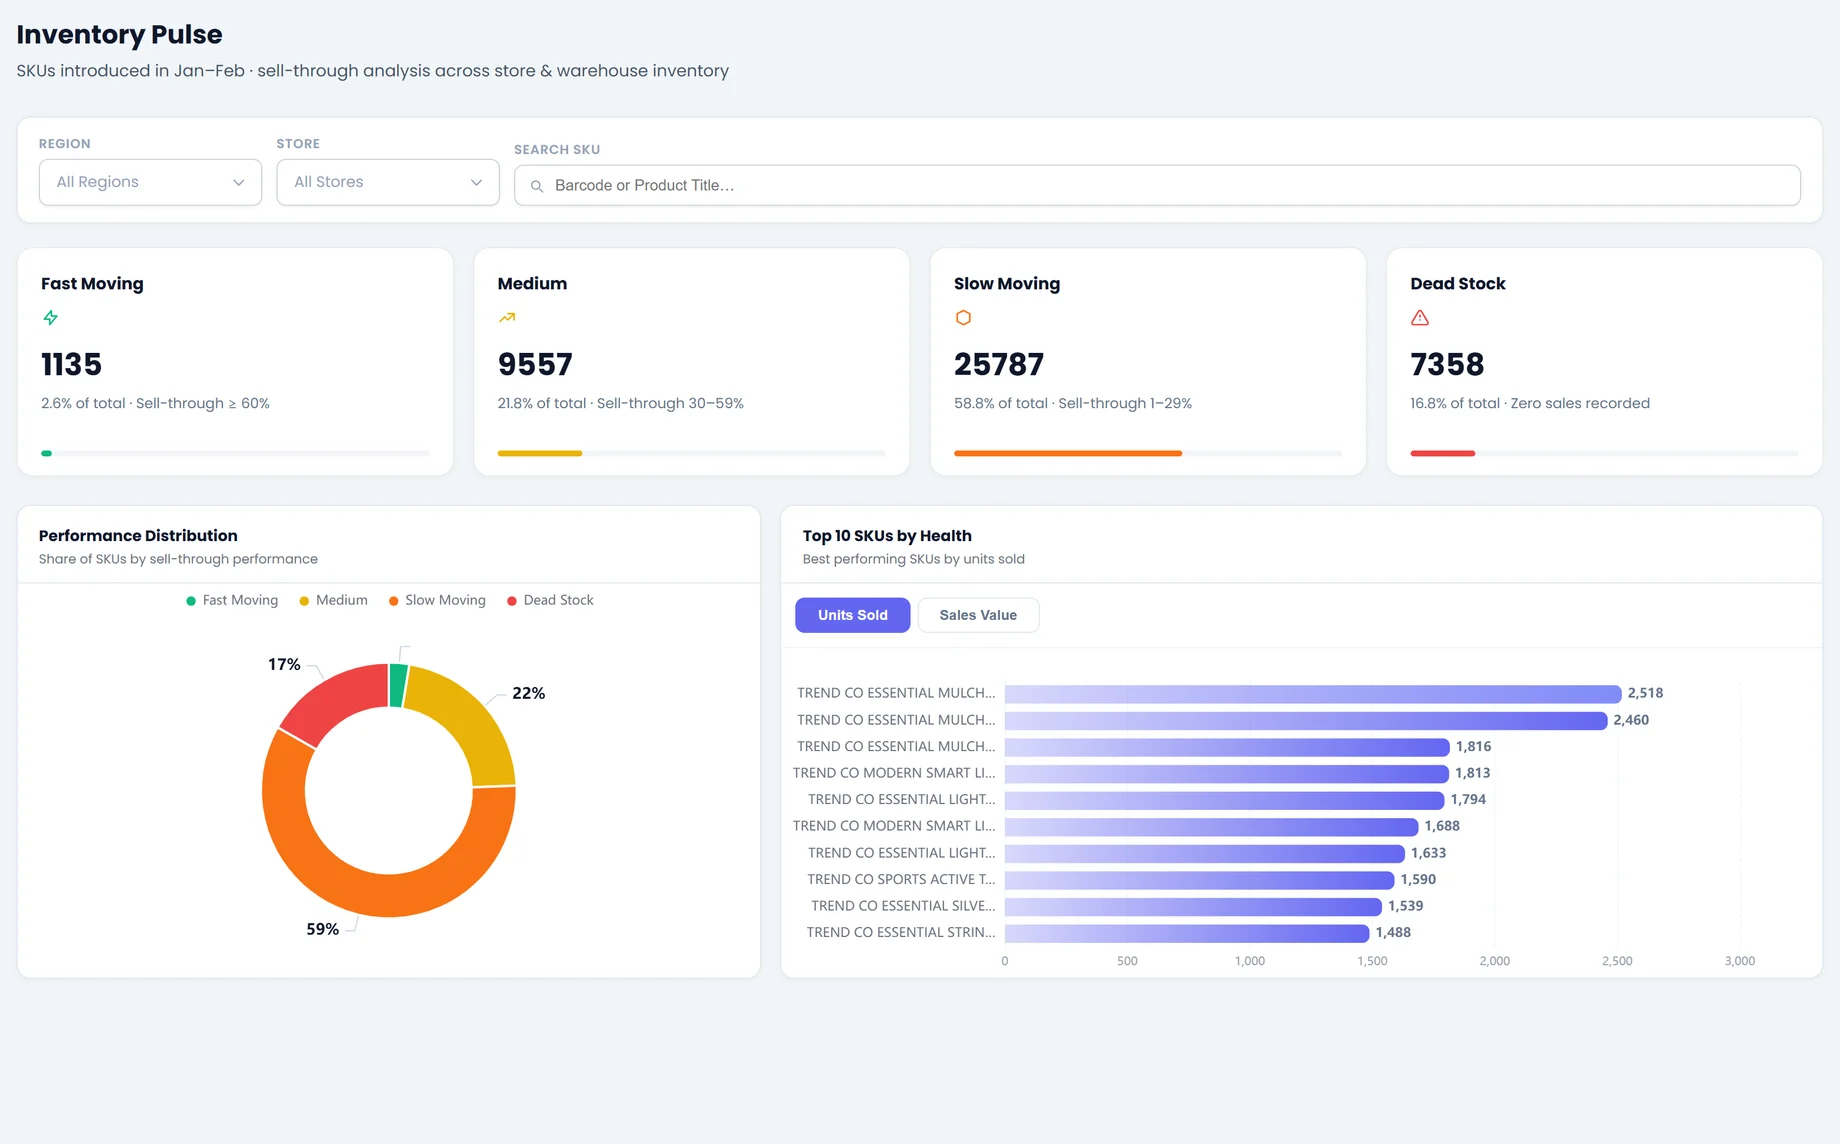
In the chart above, 17% of everything launched this season has gone to zero. That is not clutter or a tidiness problem. It's working capital you already converted into product, now sitting on a shelf, earning nothing and quietly aging toward a discount. The good news: dead stock is one of the few inventory problems you can see coming, provided you measure the right thing.
"Old" is the wrong test for dead stock
The instinct is to hunt dead stock by age. Aging reports bucket inventory into 30-, 60-, 90-, and 180-day piles and flag whatever's oldest. It's a reasonable starting point, and it's how most teams still do it. But age on its own misleads in both directions.
A year-round basic that's sat on the floor 200 days and still turns steadily isn't dead; it's a workhorse. A fashion launch that's 40 days old at zero sell-through is already dead. It just hasn't aged far enough to trip your report yet. Time tells you how long something has been sitting. It doesn't tell you whether it's moving.
That's why the view we're using, Inventory Pulse, doesn't sort by age at all. It sorts every SKU into four bands by sell-through velocity:
- Fast Moving: sell-through ≥ 60%. That 60% line isn't arbitrary; it's roughly where the apparel industry calls demand "healthy."
- Medium: 30–59%. Selling, but worth watching.
- Slow Moving: 1–29%. Underperforming; a markdown or reallocation candidate.
- Dead Stock: 0%. Months on the floor with effectively no offtake.
The real cost is cash, not clutter
It's tempting to file dead stock under housekeeping: crowded backrooms, messy shelves. The real cost sits on the balance sheet, and it compounds every month it goes unaddressed.
- Trapped working capital. Every dead SKU is cash you turned into product that hasn't turned back into cash. It can't fund next season's buy.
- Carrying cost. Storage, handling, insurance, shrinkage and obsolescence (commonly estimated at 20–30% of an item's value per year) bleed quietly for as long as it lingers.
- The markdown tax. Dead stock rarely leaves at full price, and the longer you wait, the deeper the cut. End-of-season sell-through under ~60% is exactly what escalates markdowns.
- Opportunity cost. The shelf facing, the open-to-buy dollars, the planner's attention: all spent on something that isn't selling instead of something that could.
Finding every dead SKU in one click
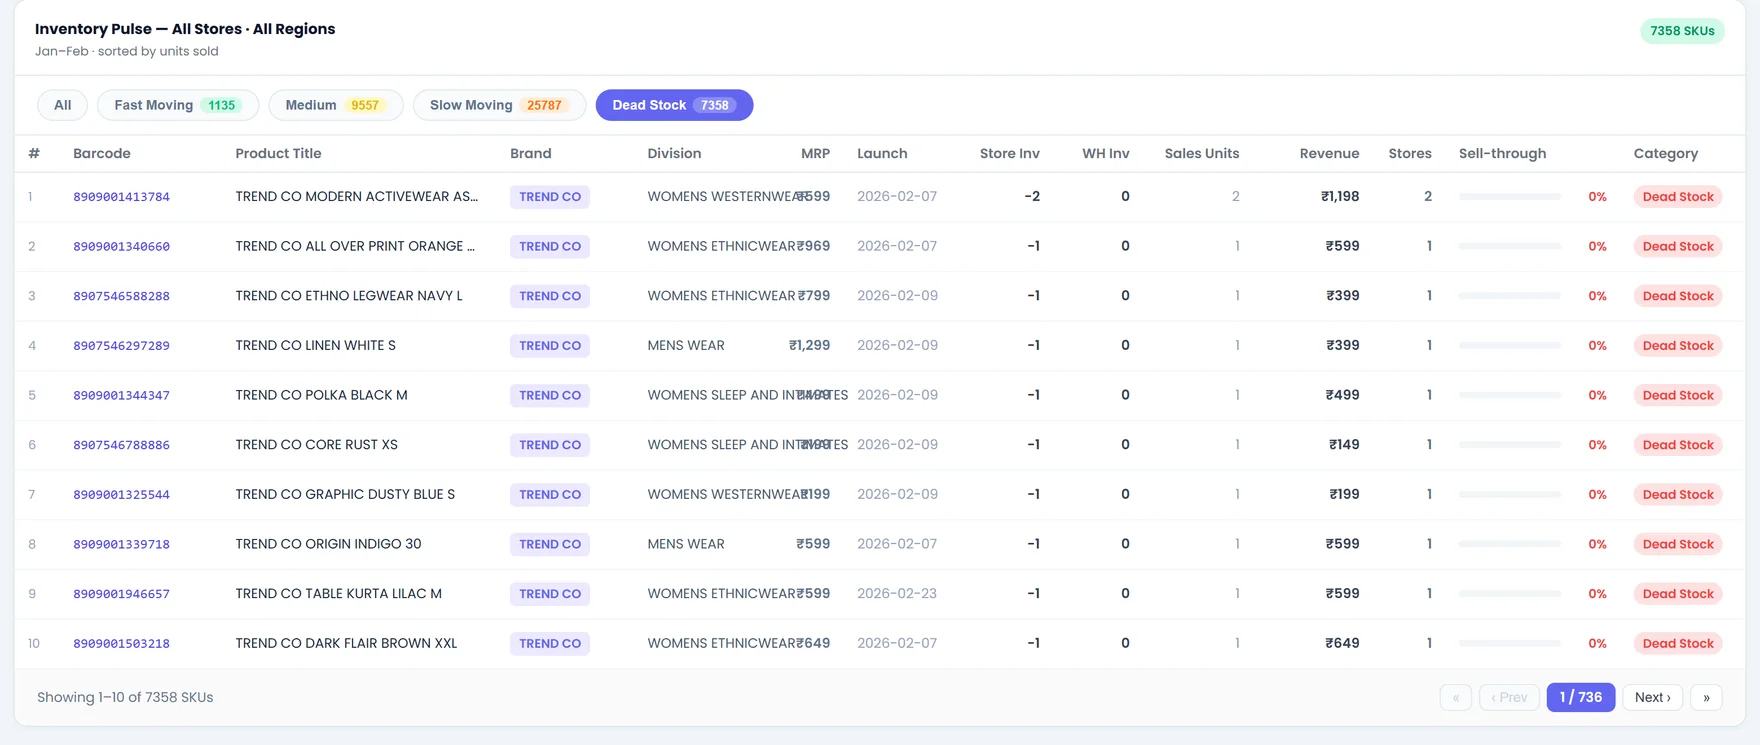
A percentage is a headline, not a to-do list. The reason banding by sell-through matters is that the headline is also a filter. Click the Dead Stock band and those 7,358 abstract SKUs become a working list: barcode, product, division, MRP, launch date, the store and warehouse units still sitting, and the revenue riding on each.