In 43,837 SKUs, just 1,135 do the heavy lifting, and they're the stock you're most likely to run out of. How to find your fast movers and protect them.
Field Notes8 min readJul 2026
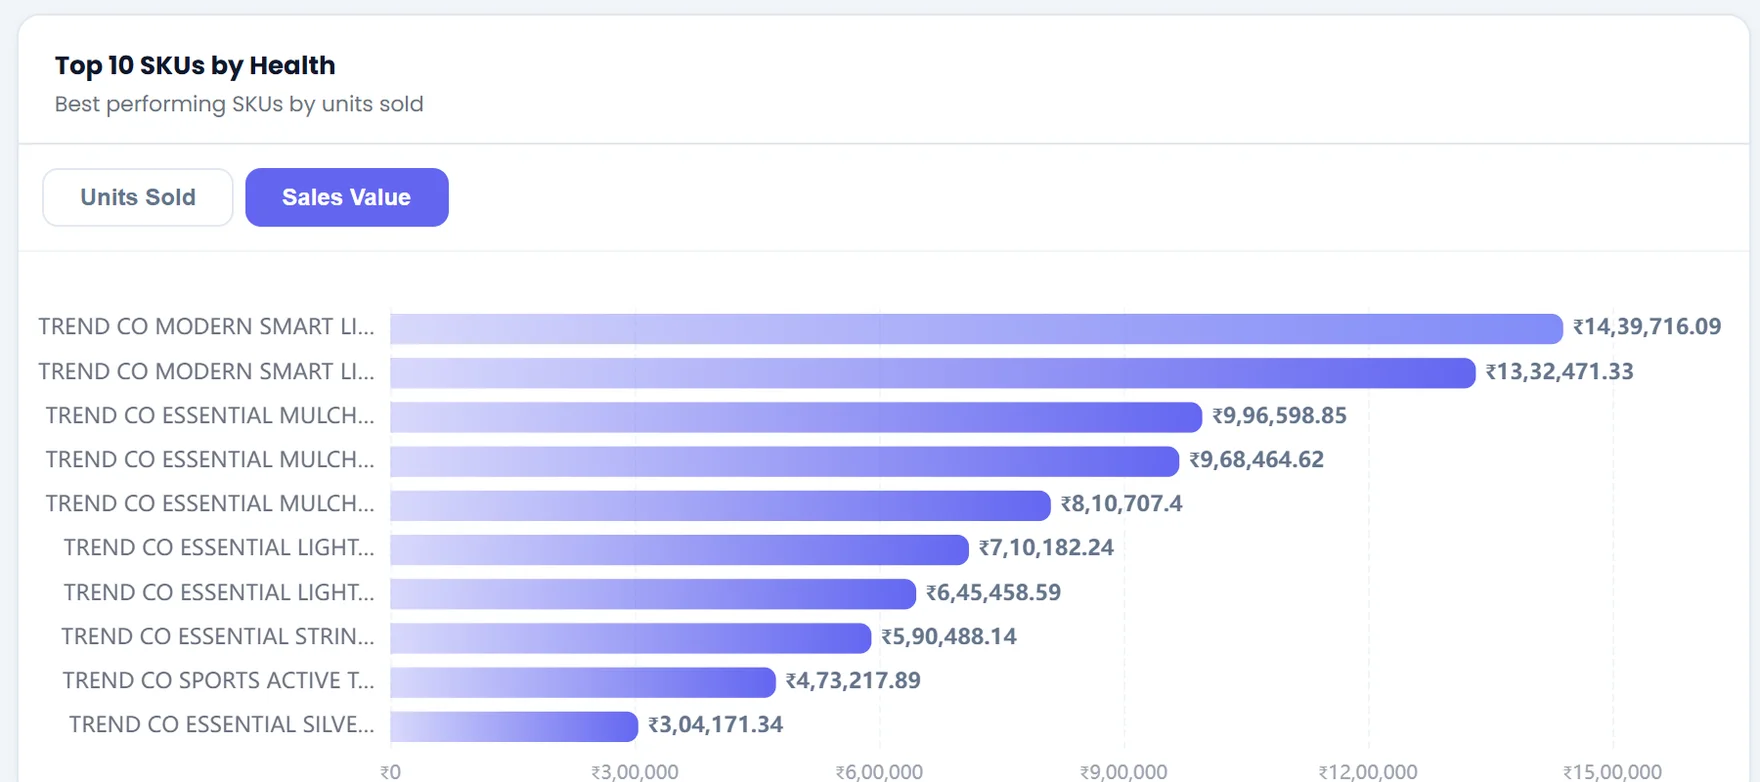
Inventory Pulse, Top 10 SKUs by sales value. Ten SKUs out of 43,837. The leader earns over fourteen lakh (₹14,39,716) on its own.
Every retailer has a number they don't quite believe until they see it on their own catalogue: the share of SKUs that actually earns the money. Here it is 2.6%. Out of 43,837 products in this assortment, just 1,135 clear the Fast Moving line. That thin band is not a rounding error or a slow month. It is the head of the store, and almost everything that matters, the cash coming back, the shelves worth defending, the buys worth repeating, is concentrated inside it.
The instinct in most inventory reviews is to spend the meeting on the problems: the slow stock, the dead stock, the markdown list. Useful work, and we have written about the dead end of that curve before. But the highest-leverage move in the room is usually the opposite one. Find the vital few that are working, and make absolutely certain nothing gets in their way.
The math nobody likes, but everyone lives inside
What you are looking at is the Pareto principle wearing a retail uniform. A small share of SKUs drives most of the return; the rest is a long, thin tail. Formalised as ABC analysis, the rule of thumb is that Class A items, roughly 10 to 20% of SKUs, produce around 80% of revenue. Class B is the moderate middle. Class C is half your catalogue earning a rounding error.
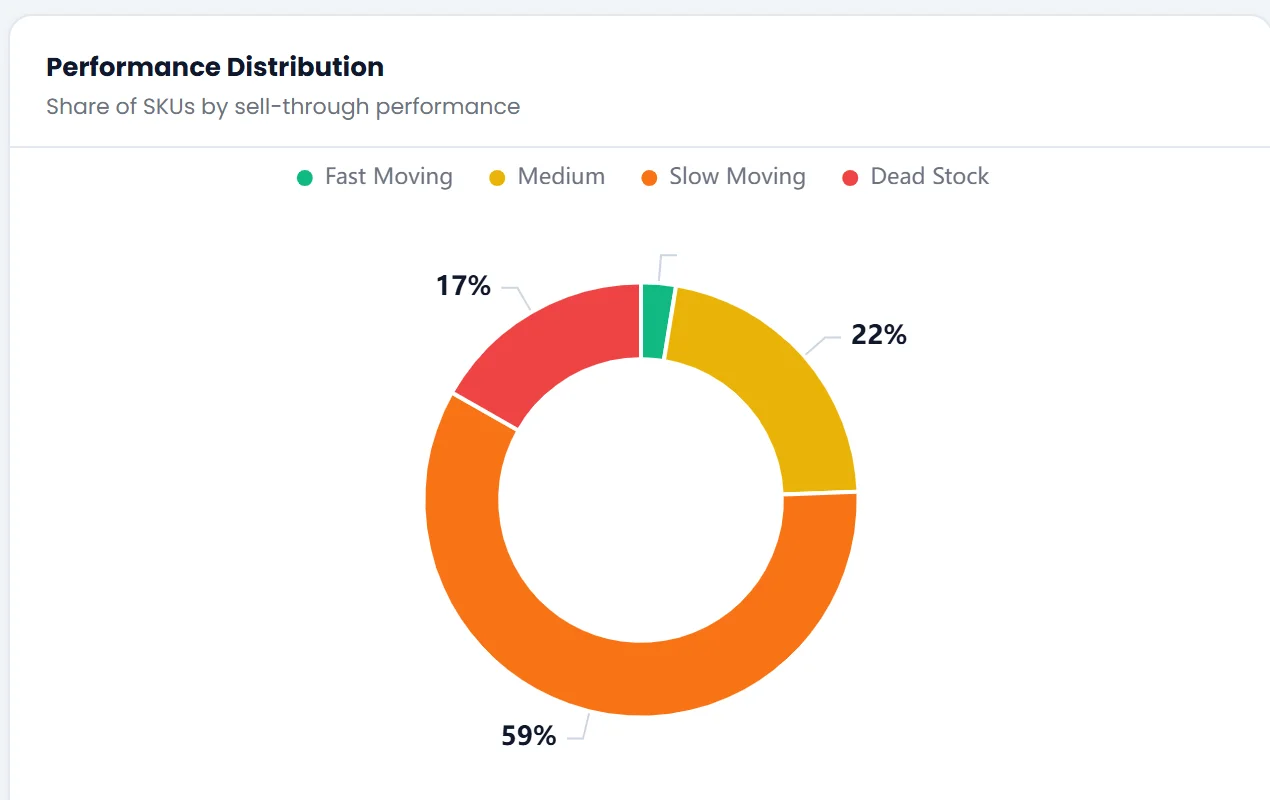
This assortment is more concentrated than the textbook: the Fast Moving head is 2.6%, and the two slow tails, Slow Moving and Dead Stock, are more than three-quarters of every SKU on file. You can see the whole distribution in a single ring.
Share of SKUs by sell-through. The green sliver, Fast Moving, is 2.6% of the catalogue. Slow (59%) and Dead (17%) are the long tail.
Read defensively, that ring looks like bad news: so little green. Read correctly, it is the most useful thing on the screen. It means you do not have to fix forty thousand SKUs to protect the business. You have to protect a thousand of them without fail, and manage the tail on a longer clock. Concentration is not the problem here. It is the leverage.
The tail is where you lose margin slowly. The head is where you lose the whole sale in an afternoon. Guard the head first.
Fast by units, or fast by value? They are different SKUs.
Here is where "just protect the fast movers" gets slippery: fast by what? The lead image above ranks the top ten by sales value. Flip the same board to units sold and the order rearranges itself.
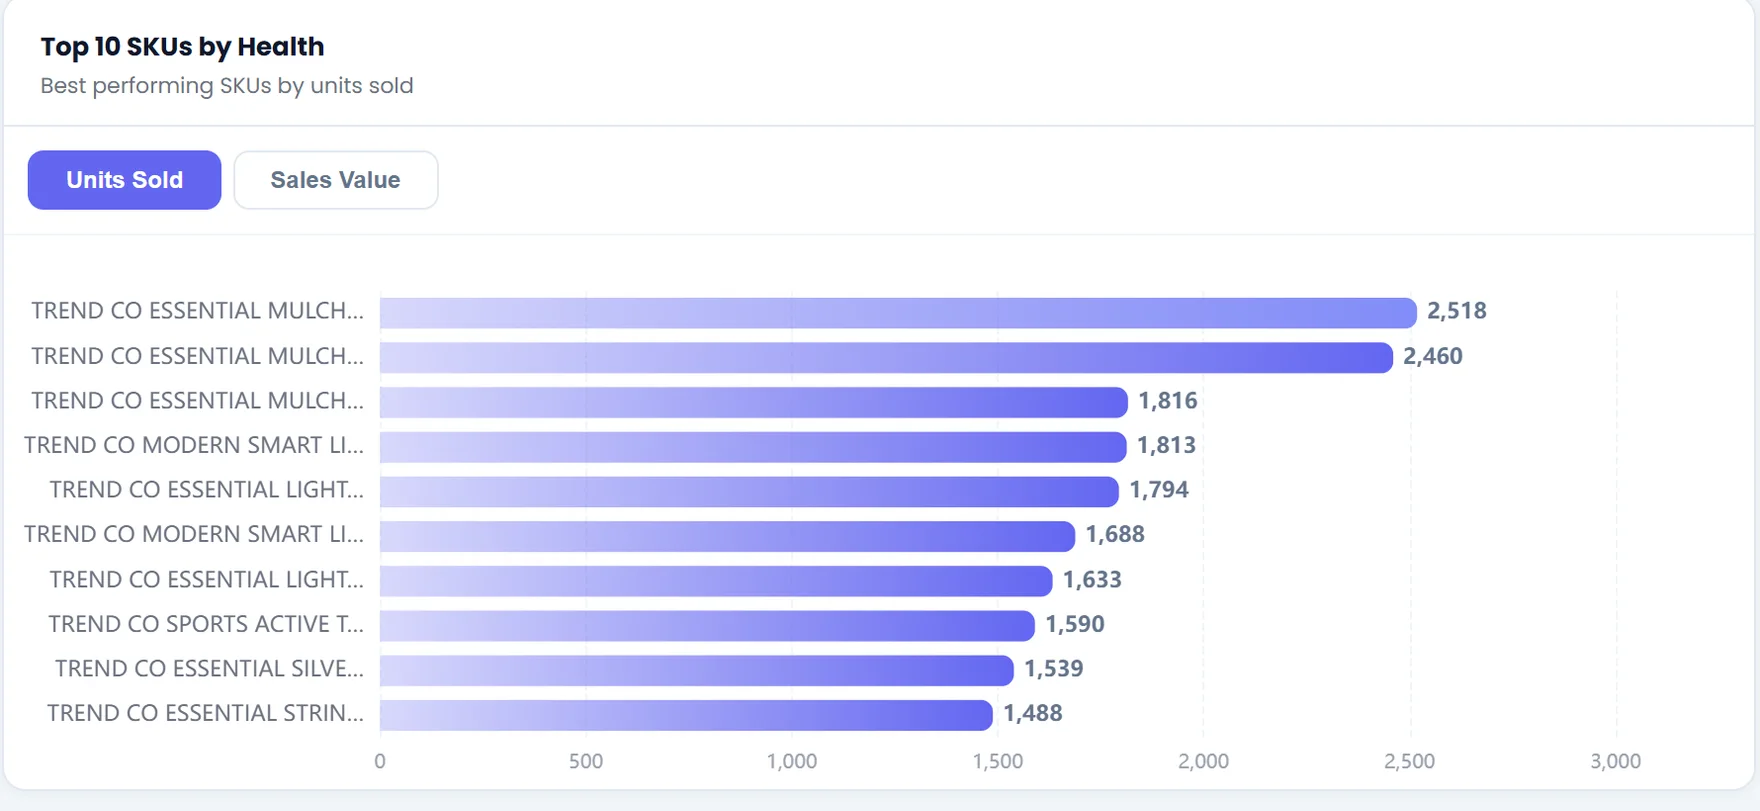
The same board ranked by units sold. The unit leader moves 2,518 pieces, but two pricier styles it out-sold earn more rupees, and lead the value chart.
Follow one product through both charts. The unit champion sells 2,518 pieces at ₹399, the most of anything in the assortment, and earns ₹9,96,599. A different style, at ₹799, sells fewer units (1,813) and earns ₹14,39,716, comfortably more. So the top SKU by units is only third by value, and a style it out-sold by 700 units is the revenue leader. Both are "fast." They are not the same SKU, and they do not want the same treatment.
Rank by units when the decision is about availability and labour: what must never be empty on the shelf, what drives footfall, what the replenishment run has to prioritise.
Rank by value or GMROI when the decision is about cash and margin: where the working capital is best spent, which winners deserve a deeper buy.
The mistake is picking one lens and forgetting the other exists. Protect the unit leaders and you keep the shelves full and the traffic happy. Protect the value leaders and you keep the P&L healthy. A real fast-mover strategy names both lists, because the cheap hero and the profitable hero are rarely the same product. Whether a fast mover is also a good buy is a separate question, and it is the one sell-through rate answers.
Your fastest movers are the ones you're most likely to stock out of
This is the cruel twist. The SKUs that clear the shelf fastest are, by definition, the ones whose shelf empties fastest. Fast movers live closest to the stockout line, and a stockout there is the most expensive gap in the store, because you are not missing a slow sale. You are missing your best one.
What a stockout on a hero SKU really costs. Retailers forfeit an estimated 7–8% of potential sales to out-of-stocks, and when a shopper hits an empty shelf, roughly 43% go buy it from a competitor. Worse, out-of-stock rates spike toward 10% during promotions, exactly when your fast movers sell hardest and a gap is most visible.
Put the two facts together and the priority writes itself. The 2.6% is both the source of most of your sales and the place a gap does the most damage. Availability on the vital few is not a hygiene metric. It is the single highest-return use of safety stock, warehouse space and a planner's attention anywhere in the operation.
Protecting the vital few
Once the head of the store is named, the playbook is unglamorous and highly effective:
Set the tightest service levels here. Higher safety stock, shorter reorder cycles and a near-zero tolerance for stockouts on the A list. Every other band can run leaner so this one doesn't have to.
Allocate them to the right doors first. The fast movers earn their prime facings and full size runs in the stores that actually sell them, before a single unit goes to a door that won't.
Cover the promo peak in advance. If a hero SKU is going on offer, its safety stock rises before the campaign, not after the shelf clears.
Deepen the buy, but keep it honest. Fast movers earn a bigger next order, up to the point where the extra depth would drag sell-through. That is the guardrail that keeps a hero from quietly becoming an over-buy.
Watch GMROI, not just velocity. A SKU can move fast on a thin margin and still be a poor use of cash. Above roughly ₹2 of gross margin per rupee of inventory is strong in most specialty categories; that is the test that keeps "fast" and "profitable" honest with each other.
Every operation has its 2.6%
The band moves with the business, but the shape holds everywhere:
FMCG and grocery: the everyday hero SKUs that must never show an empty shelf, because the shopper substitutes the brand, then the store.
Pharma and healthcare: the fast-moving essentials where a stockout is not a lost sale but a missed dose; availability is the product.
Fashion and footwear: the key items and core sizes that anchor a range; losing the middle of a size curve strands the whole style.
Manufacturing and B2B: the components and lines that keep customers running, where a gap cascades straight into someone else's downtime.
Different catalogues, same discipline: find the small head that carries the whole, and give it a level of protection the long tail will never need.
You don't win retail by fixing the tail. You win it by never running out of the head.
Most of the energy in inventory management points at what's broken: the aged stock, the markdown pile, the write-down. That work matters. But the assortment is carried by a small, identifiable few, and they rarely get the deliberate protection they earn, precisely because they aren't causing anyone a problem today. Name your 2.6%, by units and by value, guard its availability like the revenue depends on it, because it does, and you have done more for the year than any markdown ever will.
What are fast-moving SKUs?
The SKUs that sell through fastest relative to what was bought. In this dashboard, Fast Moving means sell-through of 60% or more: here, 1,135 SKUs, about 2.6% of the assortment. They are the head of the store, a small group earning a disproportionate share of sales.
What is the 80/20 rule in inventory?
The Pareto principle applied to stock: a small share of SKUs drives most of the return. In ABC analysis, Class A is typically 10–20% of SKUs producing around 80% of revenue, Class B the middle, and Class C the long tail of many items contributing little. Concentrate control and availability on the A items.
Should you rank fast movers by units or by value?
Both, because the lists disagree. Ranking by units protects shelf availability and labour; ranking by sales value or GMROI protects cash and margin. A cheap SKU can lead on units while a pricier one it out-sold leads on rupees, so pick the lens the decision needs.
How do you stop fast movers from stocking out?
Give the vital few the tightest service levels: higher safety stock, faster reorder cycles, priority allocation to the doors that sell them, and extra cover ahead of promotions, when out-of-stock rates spike just as demand peaks. A gap on a fast mover is the most expensive on the floor.
About Retalp
Embedded AI agents for retail operations.
Retalp builds AI agents that run real supply-chain and retail workflows (demand forecasting, replenishment, allocation and inventory health) on top of the systems you already use. The Journal is where we write about the operational problems underneath the software. The screens in this piece are from Inventory Pulse, our sell-through and inventory-health module.
Find your 2.6%.
Inventory Pulse ranks your own SKUs by sell-through, units and value, and flags the fast movers at risk of running dry. Book a walkthrough and we'll show you the head of your store on your data.