Sell-through rate is the number that grades the buy.
Volume flatters. Sell-through doesn't. The best-selling SKU in this assortment moved only 44% of what was bought. The one number that grades the buy, not the bestseller.
Field Notes9 min readJul 2026
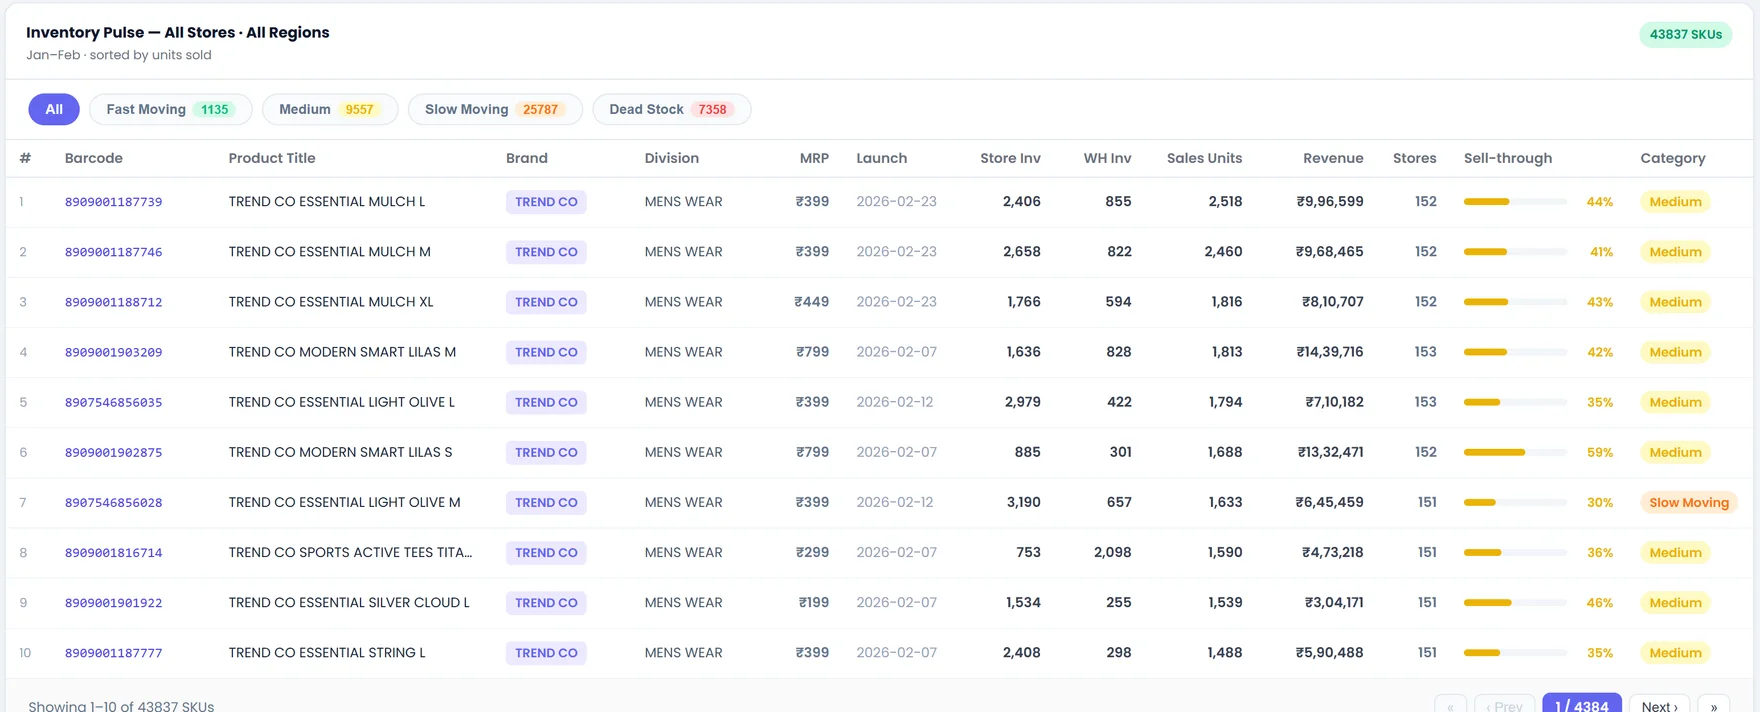
Inventory Pulse: 43,837 SKUs, each graded by sell-through. The best-seller by units (row 1, 2,518 sold) still reads 44%, tagged Medium, not Fast.
Look at the top row. It is the single best-selling product in the entire assortment: 2,518 units gone, more than any of the other forty-three thousand SKUs. By the only measure most stores celebrate, units out the door, it is the hero of the season. And its sell-through is 44%. The system doesn't tag it Fast Moving. It tags it Medium. The best-seller was also, quietly, an over-buy.
That gap is the whole reason sell-through exists. Units sold tells you how popular something is. Sell-through tells you whether the decision to buy it was right. A SKU can lead the store in volume and still be a mediocre buy, because "a lot sold" and "a lot sold relative to what we ordered" are different questions. Only the second one grades the buyer.
What the number actually measures
Sell-through is deliberately simple, and the simplicity is the point. It is the share of what you brought in that has actually sold, over a defined window.
Sell-through rate = units sold ÷ units received. Take the top row: 2,518 sold, with 2,406 still in stores and 855 in the warehouse. That is roughly 5,779 units received, and 2,518 ÷ 5,779 ≈ 44%. Same product, same strong demand, but only 44 cents of every rupee of inventory has converted back into a sale.
Notice what the formula ignores. It doesn't care how old the SKU is, how many stores carry it, or how big the headline revenue looks. The row above did nearly ten lakh in revenue (₹9,96,599) and still reads 44%, because revenue rewards a big buy and sell-through doesn't. That is exactly why it survives contact with reality: it is a ratio, so a deep buy can't flatter it. If anything, a deep buy makes it worse.
Why units lie and sell-through doesn't
Scroll the table and the pattern repeats. The rows are sorted by units sold, so the top of the list is every planner's favourite, the volume leaders. And nearly all of them sit at 30 to 59% sell-through: Medium, not Fast. These are not weak products. They are strong products that were bought as if they were even stronger.
This is the trap in ranking an assortment by units or by revenue: both reward size. Buy 10,000 of something and sell 4,000, and you will still out-rank a SKU that took in 1,000 and sold 800. The first looks like a winner on the leaderboard and reads 40% on sell-through. The second looks small and reads 80%. The second is the better buy, and only one metric will ever tell you so.
A best-seller list ranks demand. A sell-through column ranks judgement. You need both, but only one of them tells you what to order next time.
The same view sorts every SKU into four bands, and the bands are nothing but sell-through thresholds:
The four bands are just sell-through cut-offs: Fast ≥ 60%, Medium 30–59%, Slow 1–29%, Dead 0%. Here, only 1,135 SKUs (2.6%) clear the Fast line.
Read the shape of it. Only 2.6% of the assortment is Fast Moving. Nearly 59% is Slow. Almost 17% has flatlined at zero. That distribution is not unusual, and it is not a reason to panic; it is simply what an assortment looks like when you grade it honestly instead of by its highlights. The two tails are their own stories: the Dead Stock band is cash you already spent, and the thin green Fast Moving band is the handful of SKUs quietly carrying the store. This piece is about the number that draws all four lines.
There is no single good number. Set it by category.
The most common question about sell-through is "what's a good rate?", and the honest answer is that the question is incomplete. Good for what? A swimwear line and a pack of white crew socks should never be held to the same bar. The rate that signals a hit in fast fashion signals a disaster in basics, and vice versa.
Fast fashion: 80%+. Short windows, deliberate scarcity, little intention to reorder.
Mid-market apparel: ~65–75%. The workhorse range for most fashion floors.
Premium apparel: ~50–65%. Higher prices slow velocity, and that is by design.
Footwear: ~60–70%. Size and fit curves strand units even when the style works.
Health & beauty: ~75–90%. Consumable, repeatable, fast.
Grocery & FMCG: higher still, and read weekly. Perishability turns a slow rate into shrink, not markdown.
The 60% line this dashboard draws for Fast Moving maps to the point where the apparel trade calls demand "healthy." That is a sensible default for a fashion assortment. It is the wrong default for milk, and probably too soft for a fast-fashion capsule. The discipline is to set the threshold per division, then let the band do the sorting. A single global cut-off will mislabel half your catalogue.
Sell-through is an early-warning system, not a post-mortem
The costliest way to use sell-through is the most common one: pulling the number at end-of-season to explain what already happened. By then it is an autopsy. Every lever that mattered, reorder, reallocation, a shallow early markdown, expired weeks ago.
Read in-season, the same number becomes a forecast. Three weeks into a launch, a rate tracking well under its category line is telling you the buy is running long before a single unit has aged. Pair it with two companions and it becomes a decision:
Weeks of supply (on-hand ÷ average weekly sales) turns a percentage into a clock. Low sell-through plus climbing weeks of supply is the earliest reliable signature of stock that is about to become dead.
GMROI (gross margin ÷ average inventory cost) turns it into money. A high sell-through on a thin margin can earn less than a moderate one on a rich margin, and GMROI is what catches that. Above ₹2 of margin per rupee of stock is strong in most specialty categories.
Sell-through says how much of the buy has sold. Weeks of supply says how long the rest will take. GMROI says whether it was worth the cash. Watched together, weekly, they turn a lagging launch into a Tuesday decision instead of a February write-down.
One number, four jobs
The reason sell-through belongs on one shared screen is that the same figure means something different, and actionable, to each person who touches the assortment:
The buyer reads it as a report card on the last buy and a brief for the next one. A line that consistently reads 45% gets bought shallower next season, whatever its revenue rank.
The planner reads it with weeks of supply: reorder the SKUs pulling clear of the line, freeze the ones stalling below it, before open-to-buy is committed.
The allocator reads it by store: a SKU dead in ten doors and flying in forty isn't a bad buy, it is a bad split, and the fix is a transfer, not a discount.
The owner reads it as cash velocity. Sell-through is how fast the money you tied up in stock is coming back to fund the next order.
None of that needs a data team. It needs one honest column, in front of the people who buy, plan and allocate, early enough that reading it still changes the outcome.
Units tell you what sold. Sell-through tells you what to buy again.
The best-seller at the top of that table will still be the best-seller next season, because demand is real and it isn't going anywhere. The only open question is whether it gets bought at the same depth that left 56% of it sitting, or a little shallower, closer to the demand than to the hope. That single adjustment, repeated across a few hundred SKUs, is the difference between an assortment that funds itself and one that spends the year on markdown. Sell-through is the number that tells you which SKUs to make it on.
What is sell-through rate?
Units sold divided by units received, over a defined window. Take in 5,000 units, sell 3,000, and sell-through is 60%. Because it is a ratio against what you bought, it reads whether the buy was the right size, not just whether the product was popular.
What is a good sell-through rate?
Set it by category. Mid-market apparel targets roughly 65–75% at full price, fast fashion pushes past 80%, premium runs 50–65%, footwear sits around 60–70%. A practical rule of thumb: ~60%+ is healthy, under ~40% is a warning, and 0% deep into the window is dead.
Is sell-through the same as inventory turnover?
No. Sell-through grades a single buy against what you received, usually over a season. Turnover measures how many times your whole inventory cycles in a year. Read sell-through alongside weeks of supply and GMROI for the full picture.
How often should you review it?
Weekly in-season, monthly at a minimum. Sell-through is an early-warning system: a rate lagging its category line three weeks in is a signal to act while reorder, reallocation and a shallow markdown are all still on the table.
About Retalp
Embedded AI agents for retail operations.
Retalp builds AI agents that run real supply-chain and retail workflows (demand forecasting, replenishment, allocation and inventory health) on top of the systems you already use. The Journal is where we write about the operational problems underneath the software. The screens in this piece are from Inventory Pulse, our sell-through and inventory-health module.
See your sell-through on your assortment.
Inventory Pulse grades your own SKUs, stores and buys by sell-through. Book a walkthrough and we'll show you your four bands on your data.